FIN 405 — Capital Investment and Financing Decisions
Professor Gerken
Risk & Return
Financial decision making suggests that we should invest in projects that yield a return greater than the minimum acceptable discount rate (e.g. NPV>0 or IRR>r) also known as the hurdle rate
So, how do we find such a hurdle rate?
Some basic concepts
Financial resources are limited, and there are always alternative uses for capital. Thus all projects will have to return some minimum hurdle rate before being deemed acceptable.
This hurdle will be higher for riskier projects than for safer projects.
Hurdle rate = Riskless Rate + Risk Premium
The two basic questions that every risk and return model in finance tries to answer are:
- How do you measure risk?
- How do you translate this risk measure into a risk premium?
Discounting in Risk-Free World
Assume I borrow $100 and promise to pay $105 in one year
If the annual (risk-free) opportunity cost of money is 5%, then the value of next year's $105 today is
$$EV(\text{loan}) = Prob(1) \times \text{payoff} = 1 \times PV(105)$$
$$= 105 / 1.05 = 100$$
What if no longer certain?
Now say there is a 87.5% chance that I will give you $120 next year (a 12.5% chance that you get nothing) to borrow $100 today.
$$EV(\text{loan}) = Prob(\text{pay}) \times PV(120) + Prob(\text{default}) \times PV(0)$$
$$= 0.875 \times (120/1.05) + 0.125 \times (0/1.05) = 100$$
Note if we multiply through the probability, we could rewrite this as \((120/1.20) + (0/8.4) = 100\)
Thus, a 87.5% chance of 120 at 5% discount rate is equivalent to a 100% chance of 120 at 20% discount rate. So to adjust for risk, we can just discount at a rate higher than the risk-free rate
Risk
Returns generally are uncertain (opportunity and danger).
The greater the chance of a return below the expected return, the greater the risk.
Risk Premium
- "Extra" return earned for taking on risk
- Return above the risk free rate (Treasury bills are considered risk-free)
Return
A return is the change in price of an asset, investment, or project over time
Often represented in terms of price change or percentage change
Thus, for the same future cash flows, a lower price today for an asset leads to a higher return
- Imagine a asset with a payoff of 100 next period
- If the price of the asset is 90 today, then return is (100-90)/90 = 11%
- If the price of the asset drops to 80 today, then return is (100-80)/80 = 25%
Expected Returns
Expected returns are based on the probabilities of possible outcomes
"Expected" means average if the process is repeated many times
$$ E[R] = \sum_{i=1}^n p_i R_i $$
Example: Expected Returns
What are the expected returns for & ?
| State | Probability | ||
|---|---|---|---|
| Boom | % | % | |
| Normal | % | % | |
| Recession | % | % |
For : E[R] = () + () + () = %
For : E[R] = () + () + () = %
Variance and Standard Deviation
Both measure the volatility of returns
Variance is the weighted average of squared deviations
$$ \sigma^2 = \sum_{i=1}^n p_i (R_i - E[R])^2 $$
Standard deviation is the square root of the variance (\(\sigma\))
Example
| State | Probability | ABC, Inc. (%) |
|---|---|---|
| Boom | ||
| Normal | ||
| Slowdown | ||
| Recession |
What is the expected return, variance, and standard deviation?
E[R] = () + () + () + () = %
Variance = (-)^2 + (-)^2 + (-)^2 + (-)^2 = <\span>
Standard Deviation = sqrt() = %
Portfolio Return & Variance
$$ E[R_p] = \sum_{j=1}^m w_j E[R_j] $$$$ \sigma^2 = \sum_{i=1}^n w_i (R_i - E[R])^2 $$
Example
50/50 investment between Fortune Brands & Homestake Mining
| State | Probability | Fortune | Homestake |
|---|---|---|---|
| Boom | 0.4 | 30% | -5% |
| Bust | 0.6 | -10% | 25% |
Expected return and standard deviation
- Each stock
- The portfolio
Example
50/50 investment between Fortune Brands & Homestake Mining
| State | Probability | Fortune | Homestake | 50/50 Portfolio |
|---|---|---|---|---|
| Boom | 0.4 | 30% | -5% | .5(30%)+.5(-5%)=12.5% |
| Bust | 0.6 | -10% | 25% | .5(-10%)+.5(25%)=7.5% |
Expected return
- Each stock
- The portfolio
E(R_Fortune)=.4(30%)+.6(-10%)=6%
E(R_Homestake)=.4(-5%)+.6(25%)=13%
E(R_Portfolio)=.4(12.5%)+.6(7.5%)=9.5%
Example
50/50 investment between Fortune Brands & Homestake Mining
| State | Probability | Fortune | Homestake | 50/50 Portfolio |
|---|---|---|---|---|
| Boom | 0.4 | 30% | -5% | .5(30%)+.5(-5%)=12.5% |
| Bust | 0.6 | -10% | 25% | .5(-10%)+.5(25%)=7.5% |
Standard Deviation
- Each stock
- The portfolio
Variance(Fortune)=.4(30-6)^2+.6(-10-6)^2
SD(Fortune)=19.6%
Variance(Homestake)=.4(-5-13)^2+.6(25-13)^2
SD(Homestake)=14.7%
SD(Portfolio)= 2.45%
Portfolio Returns
Another Example
| State | Probability | IBM | HP |
|---|---|---|---|
| Boom | % | % | |
| Normal | % | % | |
| Recession | % | % |
What is the expected return and standard deviation for a portfolio with an investment of in IBM and in HP?
Solution — Portfolio Expected Return
Weight in IBM = / ( + ) =
Weight in HP = / ( + ) =
| State | Prob | IBM | HP | Portfolio Returns |
|---|---|---|---|---|
| Boom | % | % | () + () = % | |
| Normal | % | % | () + () = % | |
| Recession | % | % | () + () = % |
E[R] on Portfolio
=
()
+
()
+
()
=
%
Solution — Portfolio Standard Deviation
E[R] on Portfolio = %
| State | Prob | Port Ret | Squared Difference |
|---|---|---|---|
| Boom | % | (% - %)\(^2\) = | |
| Normal | % | (% - %)\(^2\) = | |
| Recession | % | (% - %)\(^2\) = |
Standard Deviation of the Portfolio
=
[
()
+
()
+
() ]^(1/2)
=
%
Types of Risk
Systematic
- Risk factors that affect a large number of assets
- Non-diversifiable risk, Market risk
Unsystematic
- Risk factors affecting a limited number of assets
- Unique risk, Asset-specific risk, Idiosyncratic risk
Portfolio Diversification
Investment in several different asset classes
- 50 internet stocks — not diversified
- 50 stocks across 20 industries — diversified
Can substantially reduce returns variability without reducing expected returns
A minimum level of risk cannot be diversified away
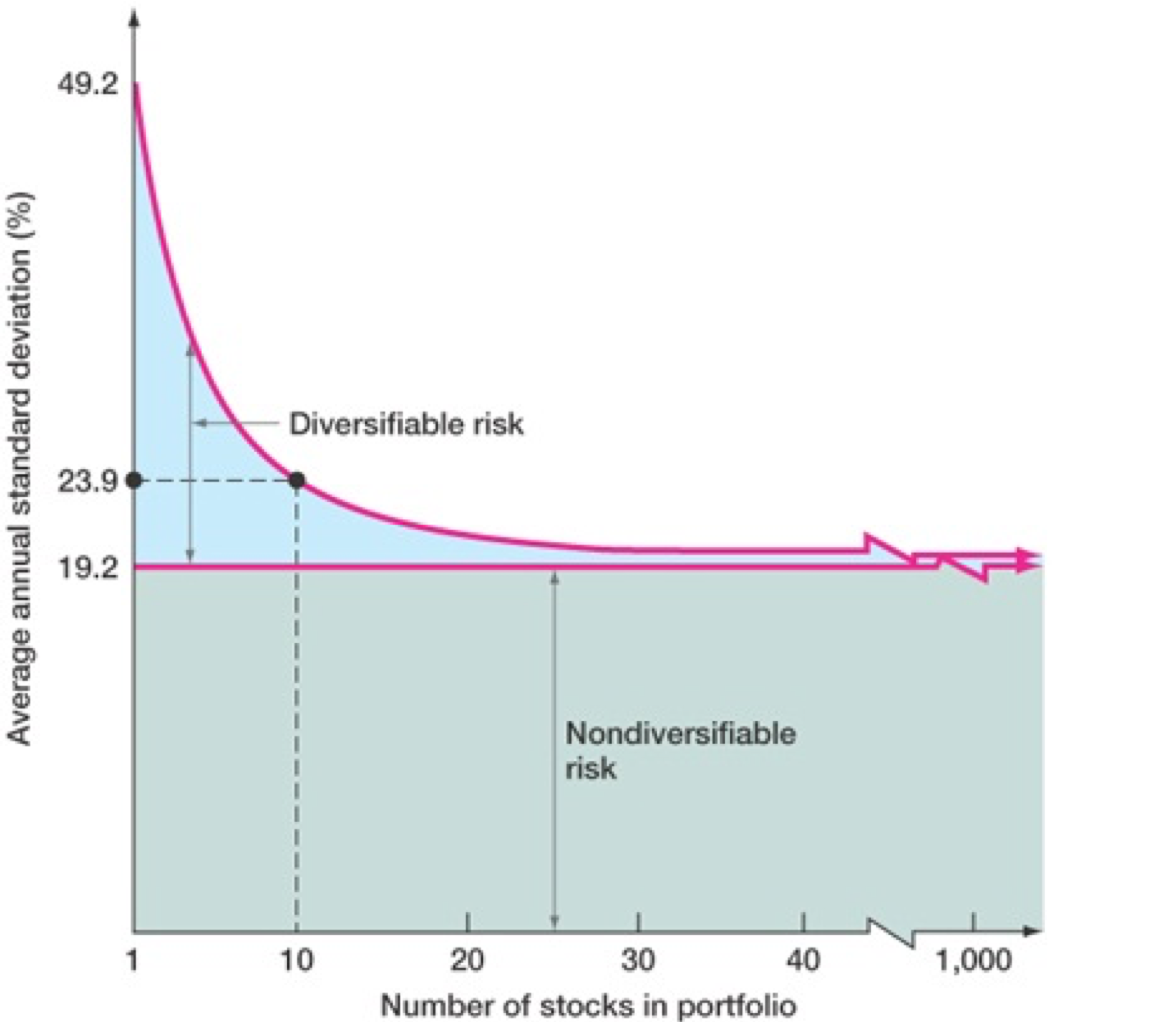
Systematic Risk cannot be diversified away
| Security | Weight | Beta |
|---|---|---|
| A | ||
| B | ||
| C | ||
| D |
Portfolio betas are linearly additive since no further diversification is possible
What is the portfolio beta?
\(\beta_P = w_1 \beta_1 + w_2 \beta_2 + w_3 \beta_3 + \dotsb =\)
\(\beta_P\) =
()
+
()
+
()
+
()
\(\beta_P\) =
Unsystematic Risk
Diversifiable or unsystematic risk can be eliminated by combining assets into a portfolio
Total risk = systematic risk + unsystematic risk
- Standard deviation of returns measures total risk
- If diversified, unsystematic risk is very small
Total versus Systematic Risk
| Standard Deviation | Beta | |
|---|---|---|
| Boeing | % | |
| Merck | % |
Which has more total risk?
Which has more systematic risk?
Which should have the higher expected return?
Solution
Since has the largest standard deviation, it has the most total risk.
Since has the largest beta, it has the most systematic risk.
There is no reward (in expectation) for bearing unnecessary risk. Therefore the stock with the highest beta, , should also have the higher expected return.
Systematic Risk
Reward for bearing risk
- No reward for unnecessary risk
Beta (\(\beta\)) measures systematic risk
- Relative to overall market
What does beta tell us?
- \( \beta < 1 \): asset has less systematic risk than the market
- \( \beta > 1 \): asset has more systematic risk than the market
Beta and the Risk Premium
Risk premium = expected return – risk-free rate
Higher beta ~ higher risk premium
Can estimate the expected return when we know this relationship
We know two assets and their returns by definition
- Market portfolio earns expected market return and beta = 1
- Risk-free asset earns the risk free return and beta = 0
- We can construct portfolios from a mix of these two with any other beta based on weights of each
Beta & Returns
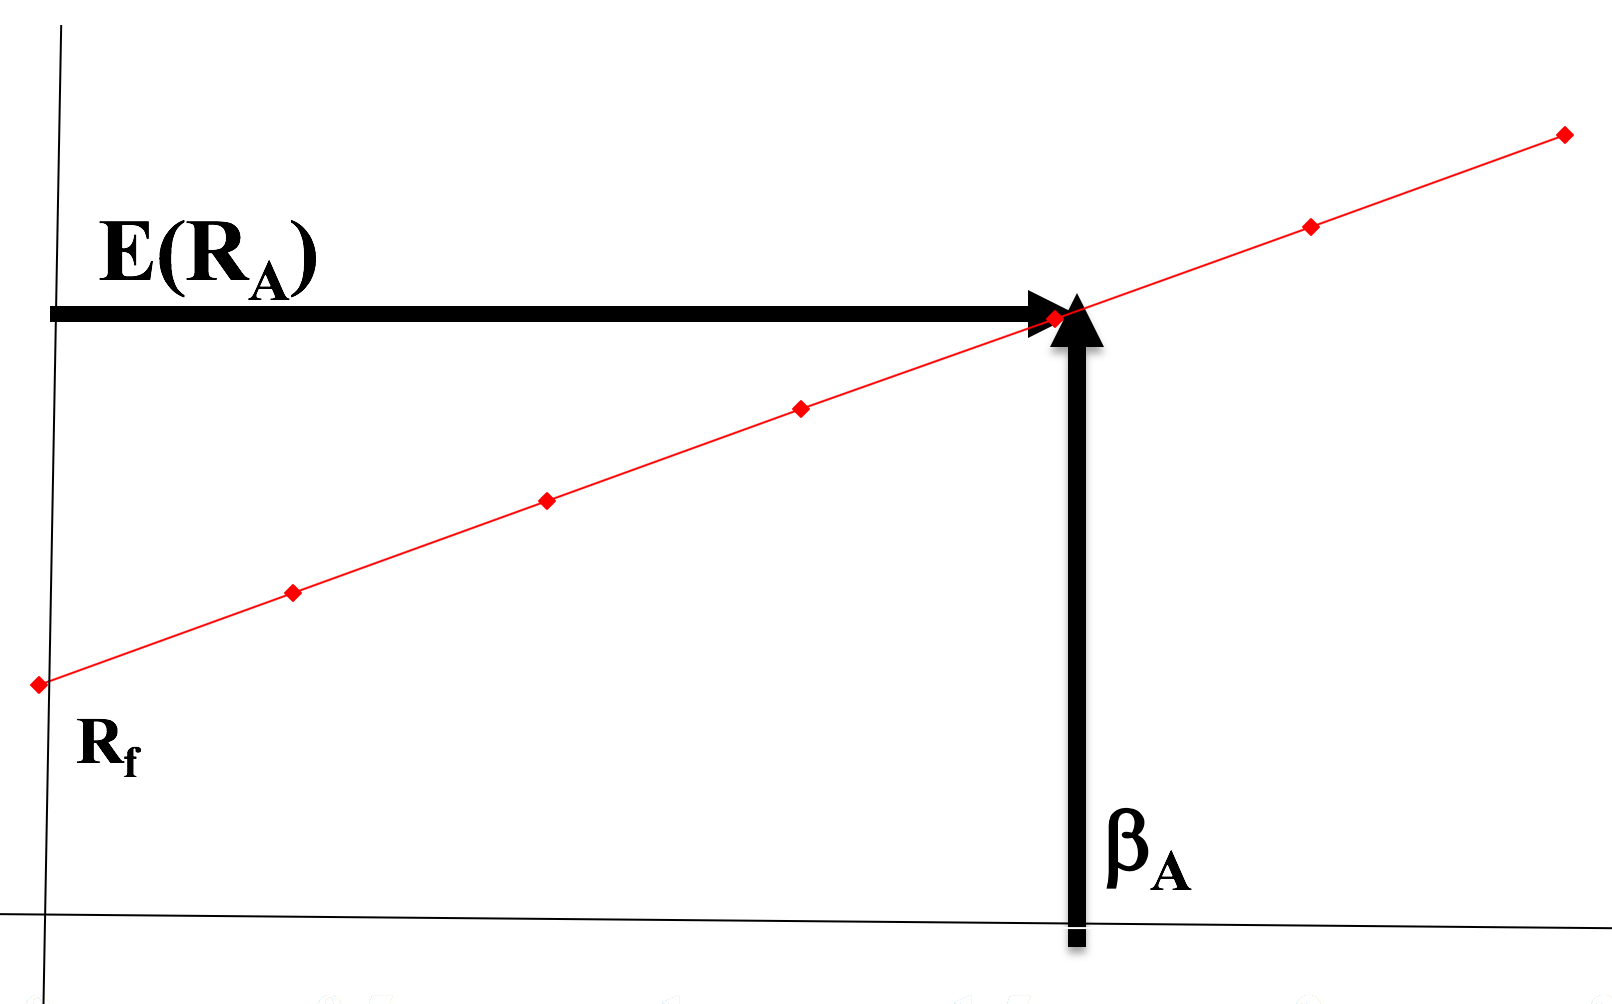
$$ \text{Slope} = \frac{\text{Rise}}{\text{Run}} = \frac{(E[R_X] - R_f)}{(\beta_X - 0)} $$
Reward to Risk Ratio
Slope of beta & return relationship
- Reward to risk ratio or the risk premium
What if an asset plots above the line?
What if an asset plots below the line?
Security Market Line
SML represents market equilibrium
- In equilibrium, all assets and portfolios must have the same reward-to-risk ratio
SML slope is the reward-to-risk ratio:
- \( (E[R_M] - R_f) / \beta_M = E[R_M] - R_f =\) market risk premium
$$ \frac{E[R_X] - R_f}{\beta_X} = \frac{E[R_M - R_f]}{\beta_M} $$
Efficient Market Hypothesis
Securities are in equilibrium: "Fairly priced" and thus pushed towards the Security Market Line
- 100k+ analysts (MBAs, CFAs, PhDs) work for investment firms
- Analysts have access to data and $$ to invest
- Thus, price reflects news almost instantaneously
One cannot "beat the market" except through good luck or inside information.
Doesn't mean you can't make money.
Efficient Market Hypothesis
Weak Form EMH
- Any information in historical prices is reflected in stock prices
Semi-Strong Form EMH
- All public information is reflected in stock prices
Strong Form EMH
- All information, even inside info, is embedded in stock prices
"On the Impossibility of Informationally Efficient Markets" Grossman and Stiglitz (1980)
- If information is costly to obtain, prices cannot perfectly reflect this information, since if it did, those who spent resources to obtain it would receive no compensation and have no incentive to obtain it.
- Thus, paradoxically inefficiencies help keep markets efficient
Risk Compensation
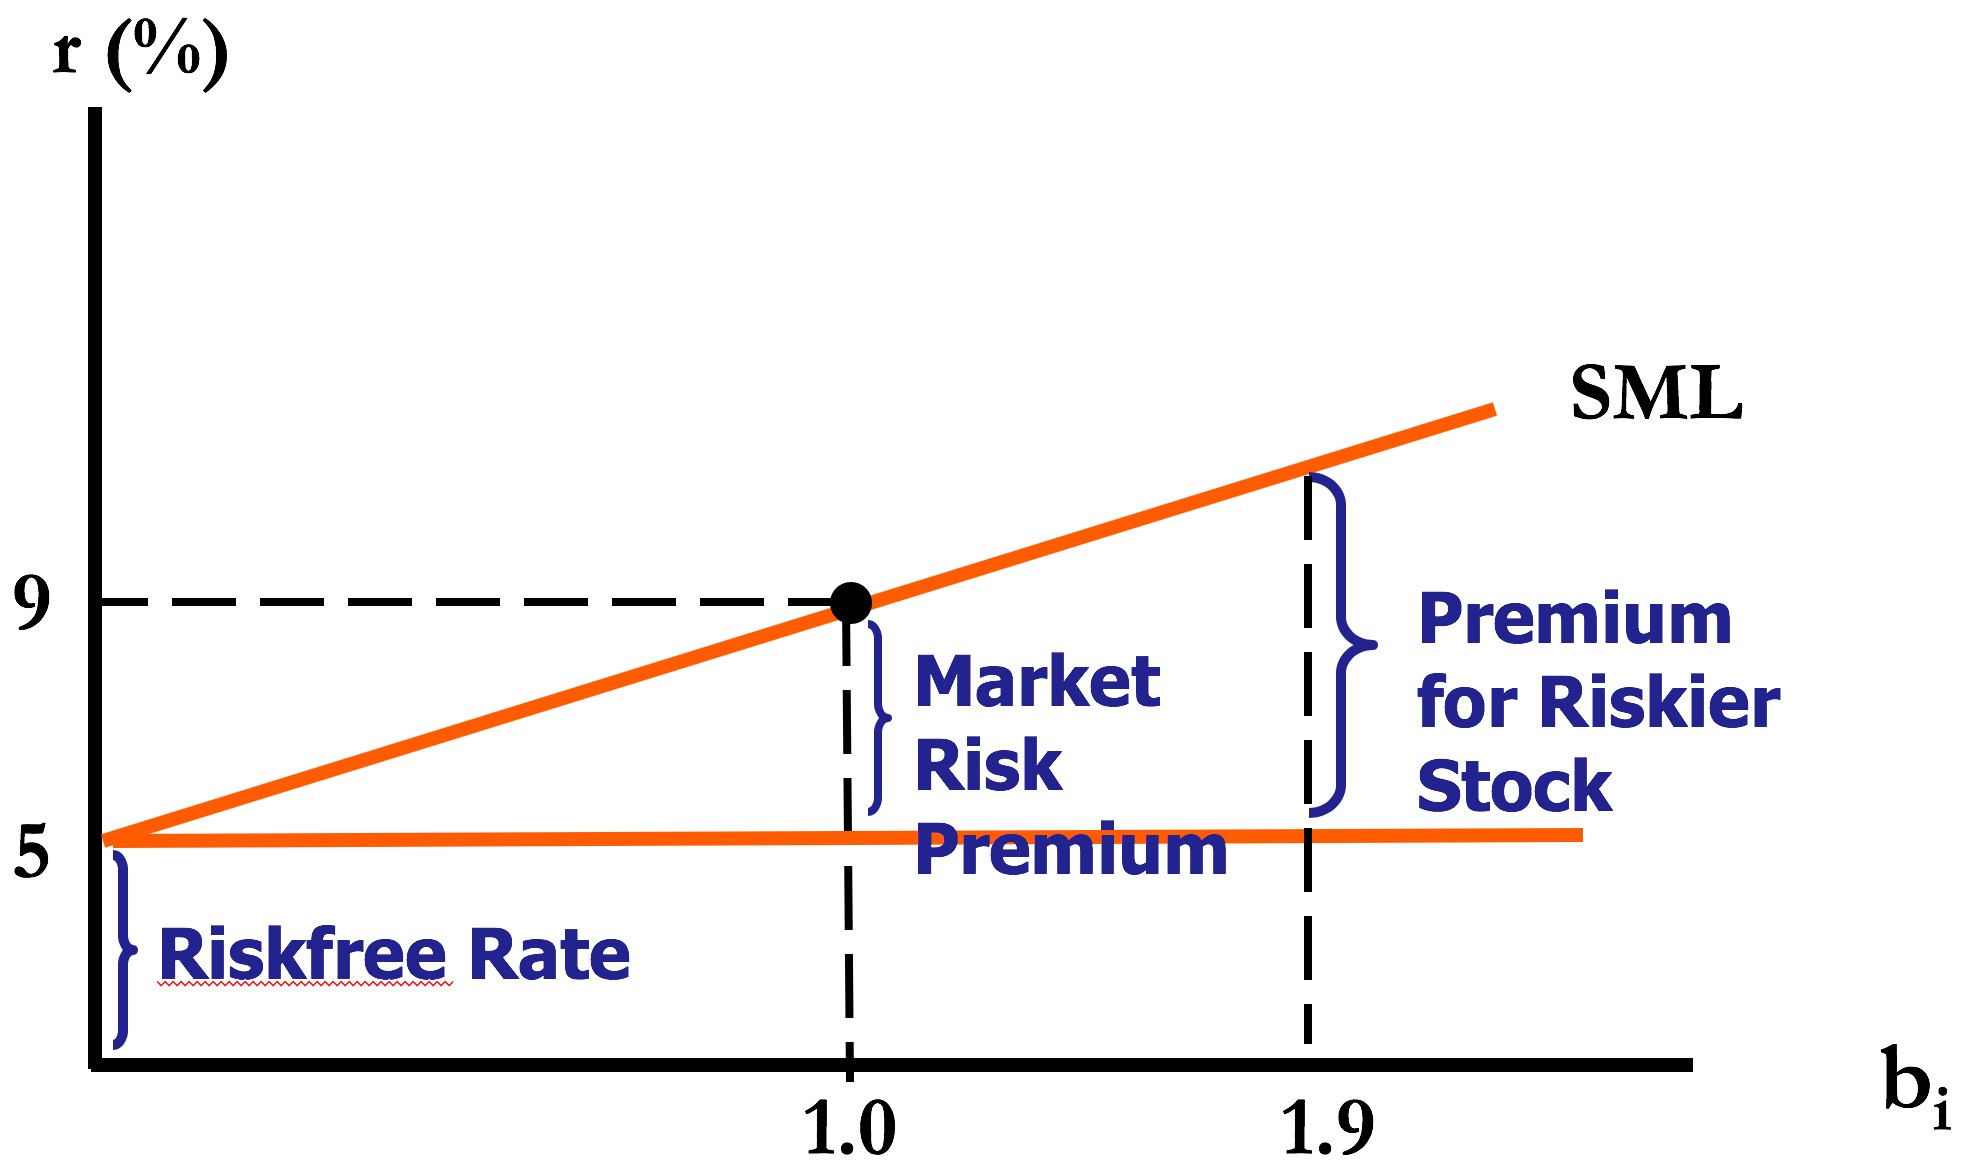
Capital Asset Pricing Model
CAPM — relationship between risk and return for asset X
\(E[R_X] = R_f + \beta_X (E[R_M] - R_f)\)
- Risk free rate
- Return for bearing systematic risk
- Amount of systematic risk
If we know an asset's systematic risk, we can use the CAPM to determine its expected return
CAPM Example
If the risk-free rate is 4% and the market risk premium is 6%, what is the expected return for each?
| Security | Beta | Expected Return |
|---|---|---|
| A | 2.0 | |
| B | 0.8 |
CAPM Example
If the risk-free rate is 4% and the market risk premium is 6% (implies expected market return is 4%+6%=10%), what is the expected return for each?
| Security | Beta | Expected Return |
|---|---|---|
| A | 2.0 | 4%+(2.0*6%)=16% |
| B | 0.8 | 4%+(0.8*6%)=8.8% |
Bottom-Up versus Top-Down Beta
The top-down beta for a firm comes from a regression
The bottom-up beta can be estimated by doing the following:
- Find out the businesses that a firm operates in
- Find the unlevered betas of other firms in these businesses
- Take a average of these unlevered betas
- Lever up using the firm's debt/equity ratio
The bottom-up beta will give you a better estimate when:
- the standard error of the beta from the regression is high (and) the beta for a firm is different from average for the business
- the firm has reorganized or restructured itself substantially during the period of the regression
- a firm is not traded
What Determines Beta?
Product or industry factors
Operating leverage
Financial leverage
Product or industry factors
Industry Effects: The beta value for a firm depends upon the sensitivity of the demand for its products and services and of its costs to macroeconomic factors that affect the overall market.
- Cyclical companies have higher betas than non-cyclical firms
- Firms which sell more discretionary products will have higher betas than firms that sell less discretionary products
Operating leverage
Operating leverage refers to the proportion of the total costs of the firm that are fixed.
Other things remaining equal, higher operating leverage results in greater earnings variability which in turn results in higher betas.
- E.g., the airline sector, which tends to have cost structures which are almost entirely fixed (plane lease expenses, fuel costs \(\ldots\))
Financial leverage
As firms borrow, they create fixed costs (interest payments) that make their earnings to equity investors more volatile.
This increased earnings volatility which increases the equity beta
Does It Make Sense to "Manage" Beta?
You are advising a very risky software firm on the right cost of equity to use in project analysis. You estimate a beta of 3.0 for the firm and come up with a cost of equity of 18.46%. The CFO of the firm is concerned about the high cost of equity and wants to know whether there is anything he can do to lower his beta.
How do you bring your beta down?
Should you focus your attention on bringing your beta down?
Estimating Beta in Practice
The standard procedure for estimating betas is to regress stock returns (\(R_j\)) against market returns (\(R_M\))
\( R_j = a + b (R_M) \)
- where a is the intercept and b is the slope of the regression.
The slope of the regression corresponds to the beta of the stock, and measures the riskiness of the stock.
Estimating Performance
The intercept of the regression provides a simple measure of performance during the period of the regression, relative to CAPM.
$$ \begin{aligned} R_j &= R_f + b (R_M - R_f)\\ &= R_f (1-b) + b (R_M) \qquad \text{Capital Asset Pricing Model} \\ R_j &= a + b (R_M) \qquad \qquad \qquad \text{Regression Equation} \end{aligned} $$If \( a > R_f (1 - b) \): Stock did better than expected during regression period
If \( a < R_f (1 - b) \): Stock did worse than expected during regression period
Firm Specific and Market Risk
Recall, we divided risk into diversifiable and non-diversifiable risk.
The R squared (\(R^2\)) of the regression provides an estimate of the proportion of the risk (variance) of a firm that can be attributed to market risk (also called systematic risk).
The balance (1 - \(R^2\)) can be attributed to firm specific risk.
Setting Up for the Estimation
- Decide on an estimation period
- Services use periods ranging from 2 to 5 years for the regression
- Longer estimation period provides more data, but firms change.
- Shorter periods can be affected more easily by significant firm-specific event that occurred during the period
- Decide on a return interval — daily, weekly, monthly
- Short intervals yield more observations, but suffer from more noise.
- Noise is created by lack of trading and biases all betas towards one.
- Estimate returns (including dividends) on stock
- Return = (Price_t - Price_t-1)/ Price_t-1
- Choose a market index, and estimate returns on the index for each interval for the period.
Choosing the Parameters: CHDN
Period used: 5 years (2010-2014)
Return Interval = Daily
- (used adjusted close to account for dividends)
Market Index: S&P 500 Index
Churchill Downs Historical Beta
(vs S&P 500)
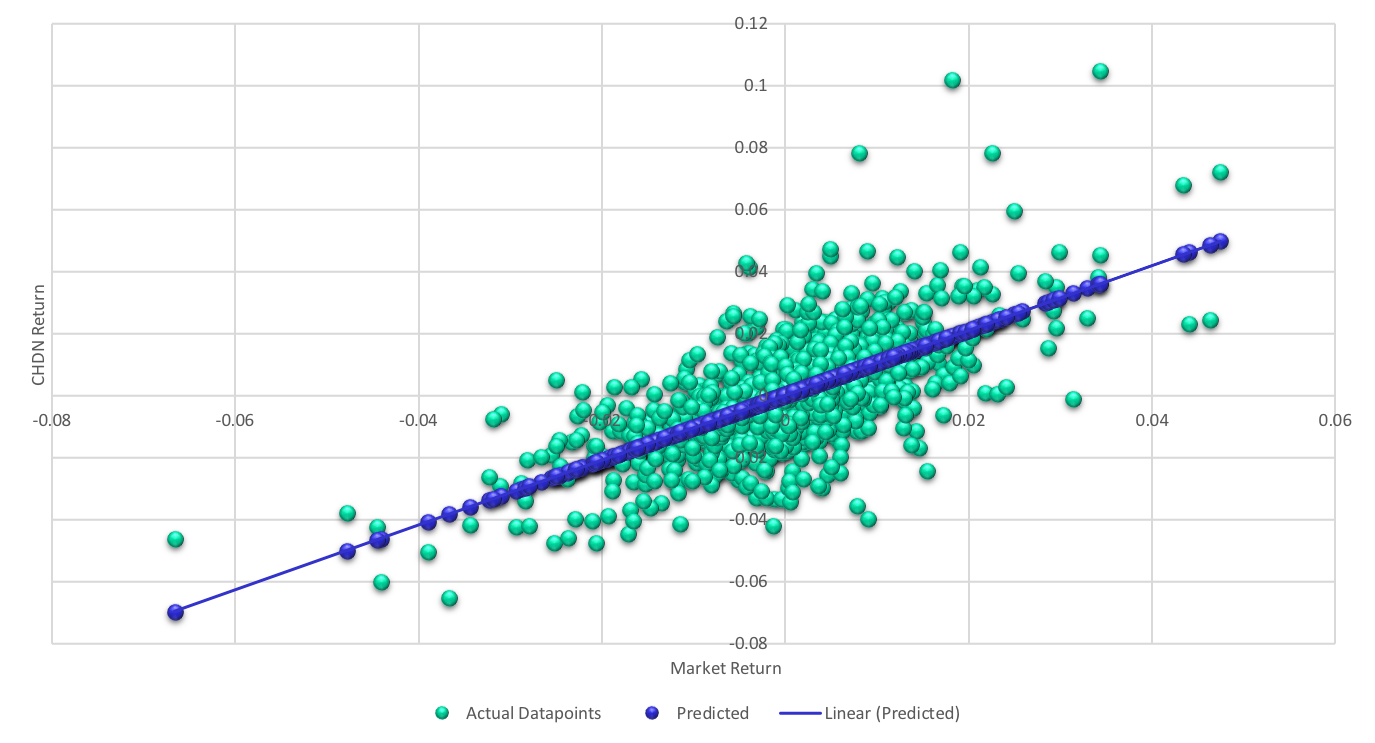
The Regression Output
Using daily returns from 2010 to 2014, we ran a regression of returns on Churchill stock against the S&P 500. The output is below:

Estimating Churchill's Beta.
Slope of the Regression of 1.048 is the beta
Regression parameters are always estimated with error. The error is captured in the standard error of the beta estimate, which in this case is 0.035.
Assume that I asked you what Churchill's true beta is, after this regression.
- What is your best point estimate?
- What range would you give me, with 68% confidence?
- What range would you give me, with 95% confidence?
Breaking Down Churchill's Risk
R Squared = 42%
This implies that
- 42% of the risk at Churchill comes from market sources
- 58%, therefore, comes from firm-specific sources
The firm-specific risk is diversifiable and will not be rewarded
The Relevance of R Squared
You are a diversified investor trying to decide whether you should invest in Churchill or Amgen. They both have betas of 1.048, but Churchill has an R Squared of 42% while Amgen's R squared of only 14.5%. Which one would you invest in?
- Amgen, because it has the lower R squared
- Churchill, because it has the higher R squared
- You would be indifferent
Would your answer be different if you were an undiversified investor?
Estimating Expected Returns for Churchill Next Year
Inputs to the expected return calculation
$$ \begin{aligned} \text{Churchill's Beta} = 1.048& \\ \text{Risk-free Rate} = 4.00\%& \text{ (U.S. ten-year T.Bond rate)} \\ \text{Risk Premium} = 4.82\%& \text{(Approximate historical} \\ & \text{ premium: 1928-2003)} \end{aligned} $$$$ \begin{aligned} \text{Expected Return} &= \text{Risk-free Rate} + \text{Beta (Risk Premium)} \\ &= 4.00\% + 1.048(4.82\%) = 9.05\% \end{aligned} $$
Use a Potential Investor in Churchill
As a potential investor in Churchill, what does this expected return of 9.05% tell you?
- This is the return that I can expect to make in the long term on Churchill, if the stock is correctly priced and the CAPM is the right model for risk
- This is the return that I need to make on Churchill in the long term to break even on my investment in the stock
Assume now that you are an active investor and that your research suggests that an investment in Churchill will yield 12.5% a year for the next 5 years.
- Based upon the expected return of 9.05%, would buy the stock?
How Managers Use this Expected Return
Management at Churchill
- needs to make at least 9.05% as a return for their equity investors to break even.
- this is the hurdle rate for projects, when the investment is analyzed from an equity standpoint
In other words, Churchill's cost of equity is 9.05%.